Mixture Design – Tarwi/chocho cookies (II)
- Daniel O
- 2 jul 2021
- 3 Min. de lectura

Actualizado: 17 oct 2021
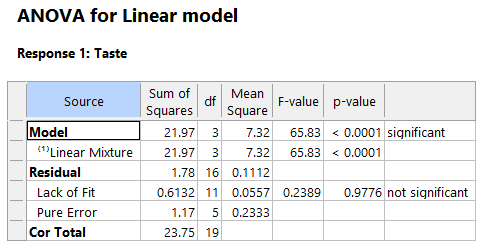
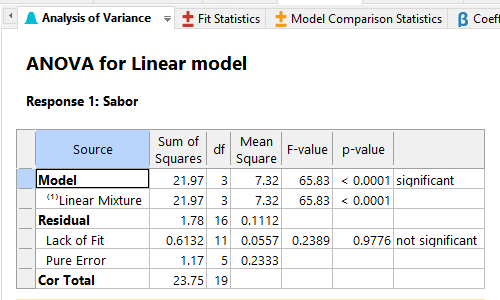
The evaluation of the main statistical parameters in mixture design will be presented below. Once the results have been entered into the matrix generated (presented in the previous publication), an ANOVA analysis is performed to determine the most influential factors on the propertiers (FLAVOR and CRISPINESS) of tarwi-based cookies. ANOVA confirms responses fit in a linear model with a p-value lower than 0.05, as well as a non-significant lack-of-fit value. Lack-of-fit value compares bias component of error and pure error. A larger bias component indicates a significant lack-of-fit.
Table 1. ANOVA of the parameters of the mixture design.
The adjusted R2 and predicted R2 value has a difference of less than 0.2 indicating that it is an adequate model. The adjusted R2 will decrease if non-significant variables are added to the model, while the predicted R2 indicates to me the efficiency of the model to predict results.
Table 2. Adjusted and predicted statistics parameters.

The coefficients in terms of the coded factors present variance inflation lower than 5, so it is considered adequate. The variance inflation factor measures how an independent variable is influenced (inflated) by its interaction/correlation with other independent variables.
Table 3. Variance inflation factor (VIF) of the coefficients of the coded factors. Figure 1 shows the tarwi cookies obtained after being in a preheated oven at 180 °C for less than 10 min.

Figure 1. Freshly baked tarwi cookies.
Contour plots of mixtures make it possible to evaluate the influence of each of the components of the mixture on the final product. The contour plot of the preparation of tarwi cookies presented (Figure 2) shows how the FLAVOR (Sabor, response) property changes according to the proportion of ingredients used in the recipe. The initial recipe evaluated presents four ingredients: Flour, milk, tarwi and butter (Harina, leche, tarwi y mantequilla). Flour, milk and tarwi are presented at the vertices of the triangle. The vertex is the zone where the maximum amount of this component is present, decreasing until it reaches the side opposite the vertex. Therefore, the area closest to the opposite side of the vertex has the lowest concentration of the component. The FLAVOR of the tarwi cookies in the figure is represented by a color scale, being blue a cookie with little FLAVOR and red a cookie with more FLAVOR.
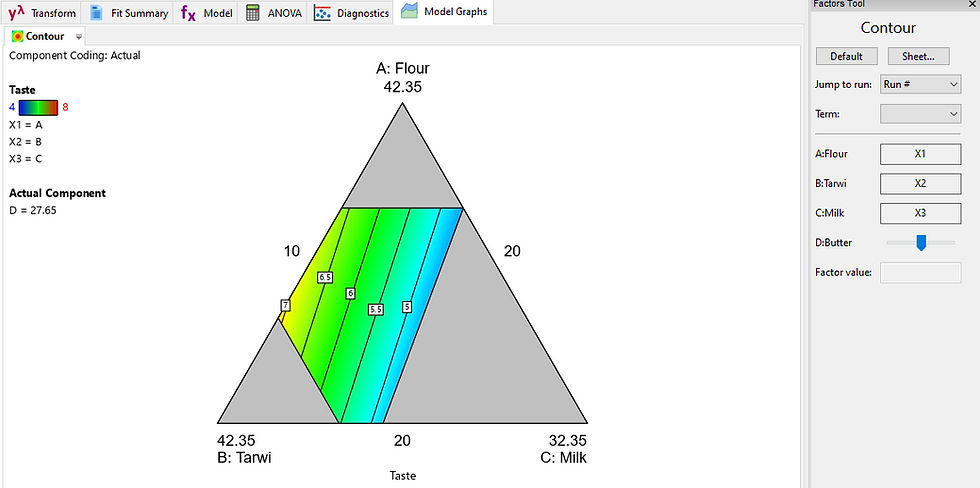
Figure 2. Contour plot of a mixed design of the FLAVOR of tarwi cookies with moderate butter content.
Figure 2 shows the variation of FLAVOR with moderate butter content, this variable is controlled by the panel located in the right column. Thus, this variable can be increased, generating Figure 3. In Figure 3 an increase in FLAVOR can already be observed (red zone). In Figure 2, with moderate butter content, a red zone could not be observed.
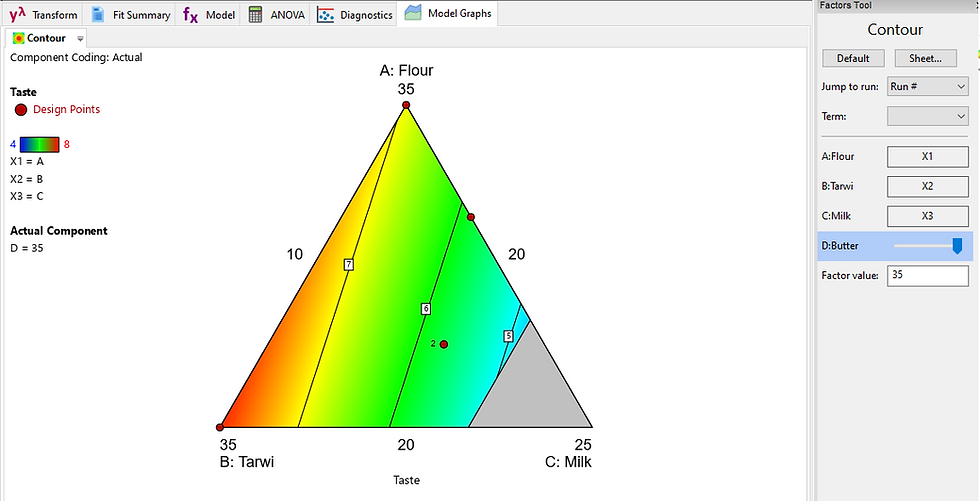
Figure 3. Contour plot of a mixed design of the FLAVOR of tarwi cookies with a high butter content.
CRISPINESS property (CROCANTE, response), is also evaluated by generating a contour plot (Figure 4). It can be seen how the CRISPINESS property increases with decreasing milk content.
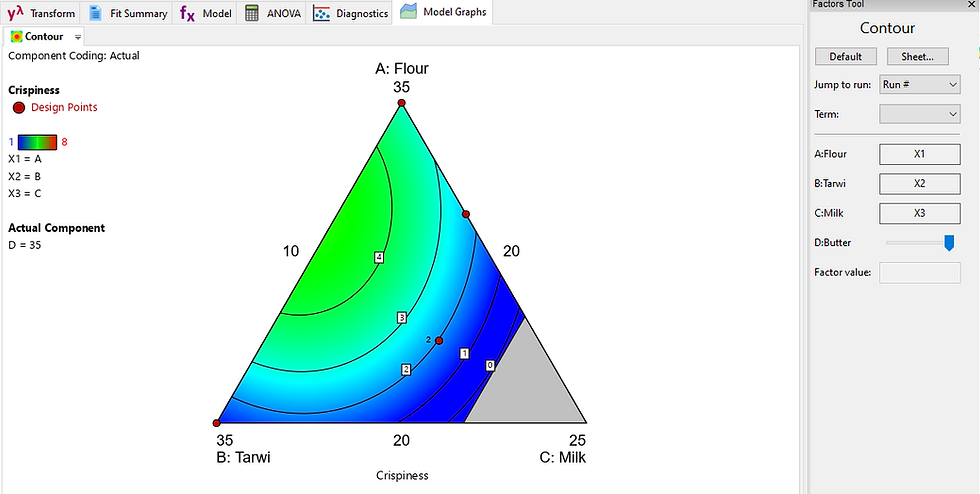
Figure 4. Contour plot of a mixed design of the CRISPINESS of tarwi cookies with a high butter content. Finally, the cookie recipe will be optimized. For this purpose, we will seek to find a recipe that maximizes the FLAVOR and CRISPINESS properties. The objectives of the optimization can be to maximize, minimize or obtain a specific value in the answer. According to the established criterion, the most appropriate desirability function will be used.
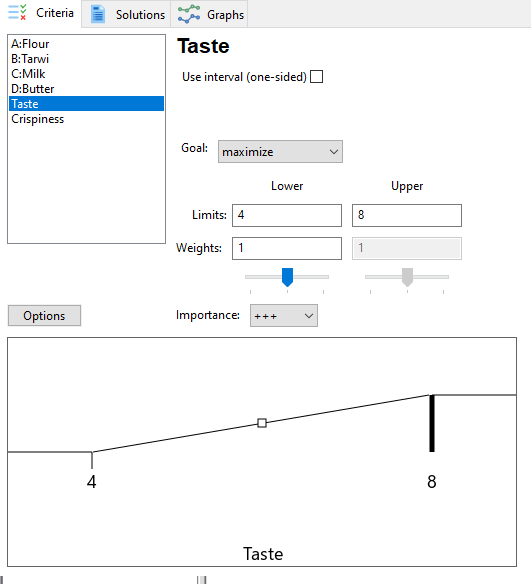
Figure 5. Establishment of optimization criteria for the tarwi cookies according to the FLAVOR and CRISPINESS criteria.
The DesignExpert 12® software from Statease (Minneapolis, USA) presents the optimization results graphically as shown in Figure 6. To do this, first the contour plots established for each factor (FLAVOR and CRISPINESS) are superimposed and the area where both meet the conditions according in the optimization criteria is delimited.
The ideal recipe for tarwi cookies with more flavor and very crunchy would be:
Flour: 32.3%.
Tarwi: 34.9%.
Milk: 10 %.
Butter: 22.9 %
The design and analysis of the case presented was carried out using DesignExpert 12® software.

Figure 6. Contour plot of mixtures of the optimum zone according to the established optimization criteria. Tarwi cookies are ready to eat!! ¡Buen provecho!
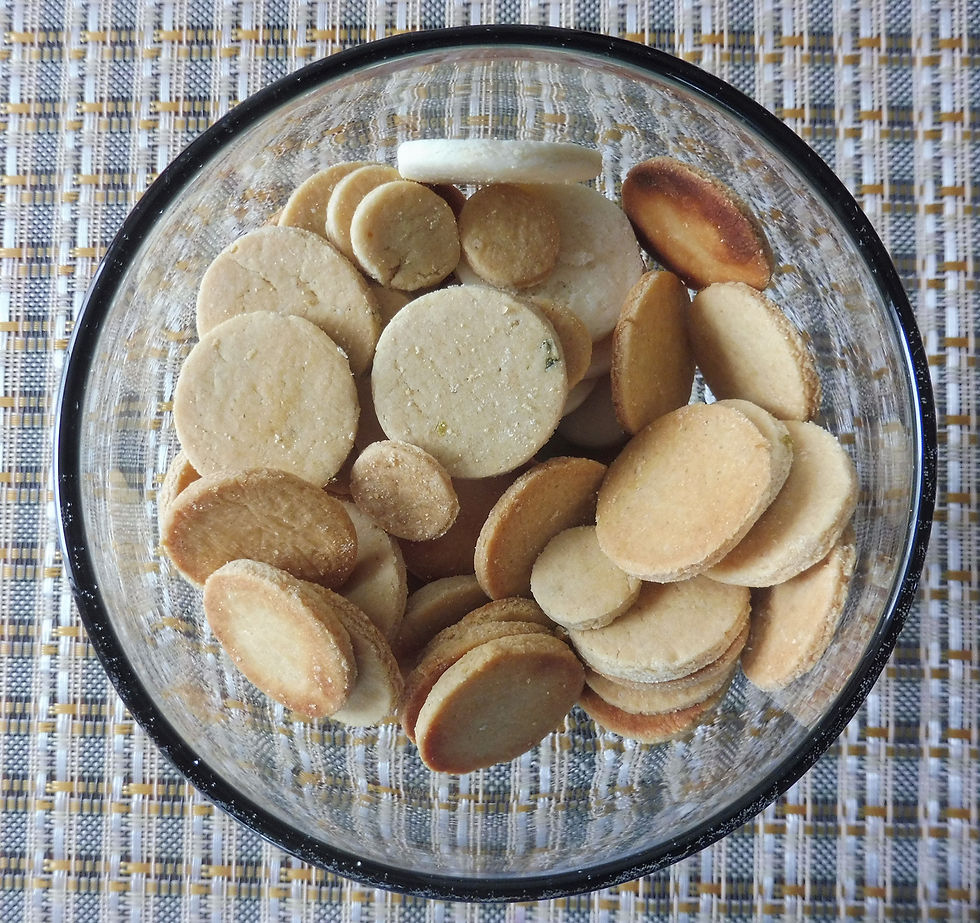
Figure 7. Ready-to-eat tarwi cookies. Acknowledgments, Special thanks to Karina, who was in charge of preparing these delicious tarwi cookies.
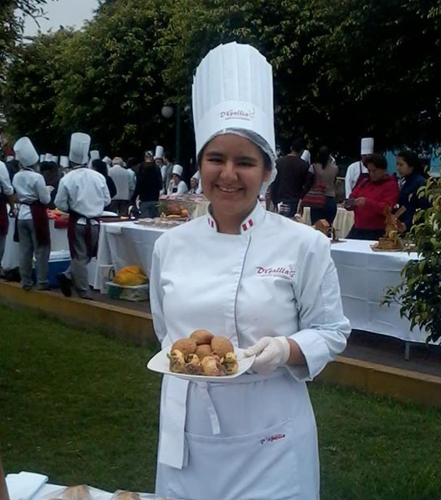
Karina A. studied pastry and since 2011 she has specialized in the preparation of desserts using Peruvian products and creating nutritious recipes. Karina also specializes in cake decoration. Her goal is to create healthy and innovative dessert recipes, showing that they can be rich and nutritious at the same time.
Search for @postresparacualacquierocasión on Facebook or Messenger to find more information about his creations.
©Daniel Obregón, 2021
Comentarios